Regression analysis is one of the Statistical models for estimating the relationship between variables. It is a model for checking the effects of a set of selected factors on the subject matter being discussed or analyzed.
The relationship that is seen in a regression model are usually between the dependent variable and one or more independent variables.
Assumptions of Linear Regression
Before you linear regression for your sets of data, one of the major things to consider is whether such is analyzable using linear regression analysis.
This has to be taken into consideration seriously because there are six assumptions of linear regression that your data should agree with for them to be suitably analysed using regression to ensure a valid result.
Though this operation takes more time than required during your statistical analyses, requiring you to click a few more buttons in SPSS Statistics when performing your analysis, as well as think a little bit more about your data, but it is not a difficult operation to embark on
Assumption One: Your two variables should be measured at the continuous level. This implies that they are either interval or ratio variables. Examples of continuous variables include revision time (measured in hours), area of land (measured in hectares) exam performance (measured from 0 to 100), weight (measured in kilograms), and so many others
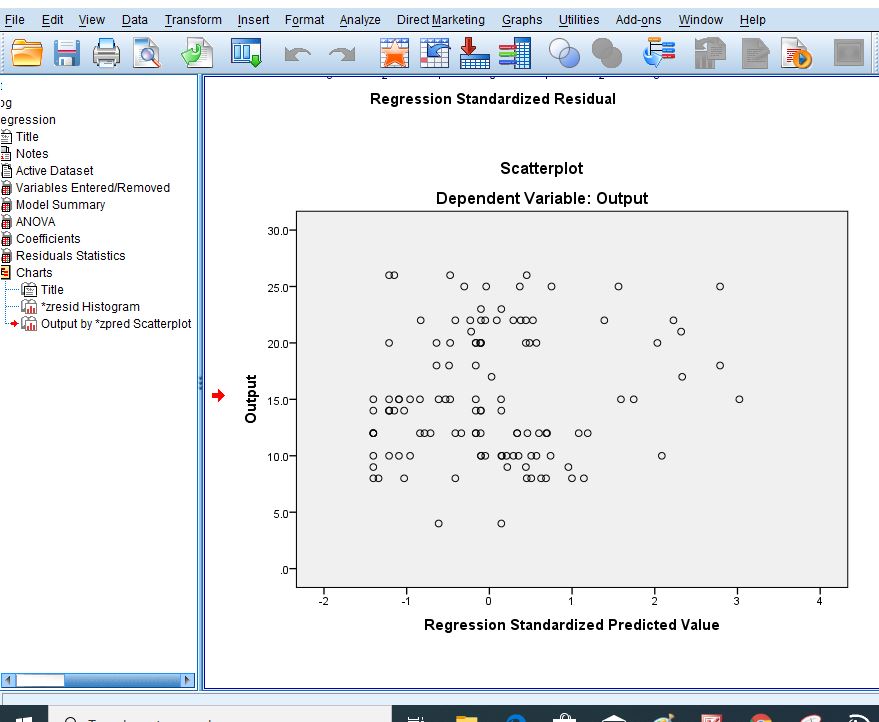
Assumption Two: There needs to be a linear relationship between the two variables. Whilst there are a number of ways to check whether a linear relationship exists between your two variables, we suggest creating a scatterplot using SPSS Statistics where you can plot the dependent variable against your independent variable and then visually inspect the scatterplot to check for linearity.
Assumption Three: There should be no significant outliers. An outlier is an observed data point that has a dependent variable value that is very different to the value predicted by the regression equation.
Assumption Four: You should have independence of observations, which you can easily check using the Durbin-Watson statistic, which is a simple test to run using SPSS Statistics. We explain how to interpret the result of the Durbin-Watson statistic in our enhanced linear regression guide.
Linear regression analysis requires that there is little or no autocorrelation in the data. Autocorrelation occurs when the residuals are not independent from each other.
Assumption Five: Your data needs to show homoscedasticity, which is where the variances along the line of best fit remain similar as you move along the line.
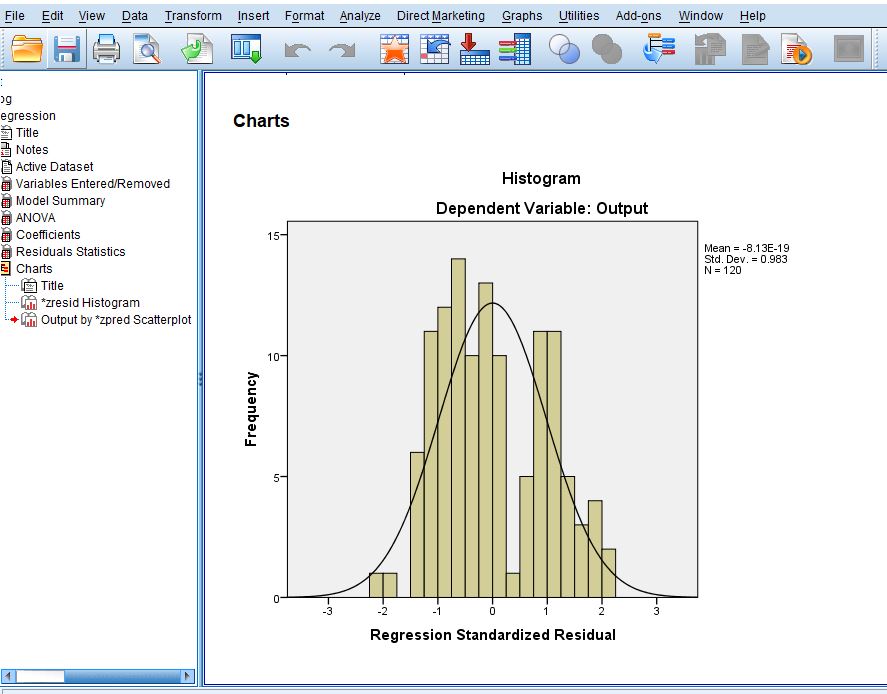
Assumption Six: Finally, you need to check that the residuals (errors) of the regression line are approximately normally distributed (we explain these terms in our enhanced linear regression guide).
Two common methods to check this assumption include using either a histogram (with a superimposed normal curve) or a Normal P-P Plot.
Note that there are possibilities that when analysing your own data using SPSS Statistics, some of your results might come out in contrary to the above-stated assumptions. You shouldn’t be amazed at this occurrence.
This is usually obtainable when working with real-world data rather than already designed templates, which often only show you how to carry out linear regression when using a standard data. However, don’t worry. Even when your data fails certain assumptions, there is often a solution to overcome this.
Related Posts:
How To Test Hypothesis In Statistics | A – Z Guides Using Practical Examples
Duncan’s Multiple Range Test On SPSS | A – Z Guides On The Analysis
Measures Of Relationship In Statistics | The Tutorial With Practical Examples
Types of Regression Analysis
Regression analysis is divided into the following;
Simple linear regression: This is when you are considering the relationship between the dependent variable and an independent variable.
Multiple linear Regressions: When the relationship is in between the dependent variable and two or more independent variables.
Non-linear Regression: This type of regression analysis does not show a linear relationship. Examples of this are: Ridge regression, Lasso regression, Polynomial regression and Logistic regression
Types of Variable in Regression Analysis
The dependent variable is also known as the outcome variable, response variable or the regressand. There is always one dependent variable in Regression analysis. It is the variable whose fate is determined by the changes of the explanatory variables.
The mean value of the dependent variable is subject to those of the independent variables. This implies that whatever happens to the dependent variable must be determined by the independent variables according to the relationship between them.
Independent variables are otherwise called explanatory variables, predictor variables, factors or regressors. In any regression analysis, there are always one or more independent variables.
As explained above, changes in the independent variables determine what happens to the dependent variable. That is, the dependent variable changes as the independent variables are changing.
For example, let us consider the Determinants of cassava output in a particular study area using some selected factors like Age of farmers, Farming Experience, Source of Fund and Farm sizes.
Here, cassava output can be represented as Y, while the selected factors as L. It means that the dependent variable is Y (cassava output), whereas L (representing Age of farmers (L1), Farming Experience (L2), Source of Fund (L3) and Farm sizes (L4)) are the independent variables. The linear regression model equation for this example can be deduced below;
Y = F(L)
Y = a + bL + E
In a more explicit form,
Y = a + b1L1+b2L2+b3L3+b4L4 + e
Where Y = cassava output
a = Intercept
b = Slope
L1 = Age of farmers
L2 = Farming Experience
L3 = Source of Fund
L4 = Farm sizes
e = Error term
The Regression equation presented above shows that the quantity of cassava output produced by the farmers in the study area depends on the Age distribution of farmers, Farming Experience, Source of Fund and Farm sizes.
To know the effects of the factors above on cassava output, analysis has to be performed based on the data collected from the variables.
How to Analyze Multiple Linear Regression Model.
SPSS is a statistical tool that can be used to run regression analysis. This article especially covers the step by step guide on how multiple linear Regression models can be analyzed.
Most people find it difficult to analyze a multitude of linear Regression models because they consider it too complex a task to perform. Following the guidelines that I am going to reveal in this article, you would be able to do it by yourself.
All you need to have is a laptop and the determination to work, and you would be able to run a multiple linear Regression analysis on your own.
The following are the easiest guides on how to run Multiple Linear Regression Analysis in SPSS.
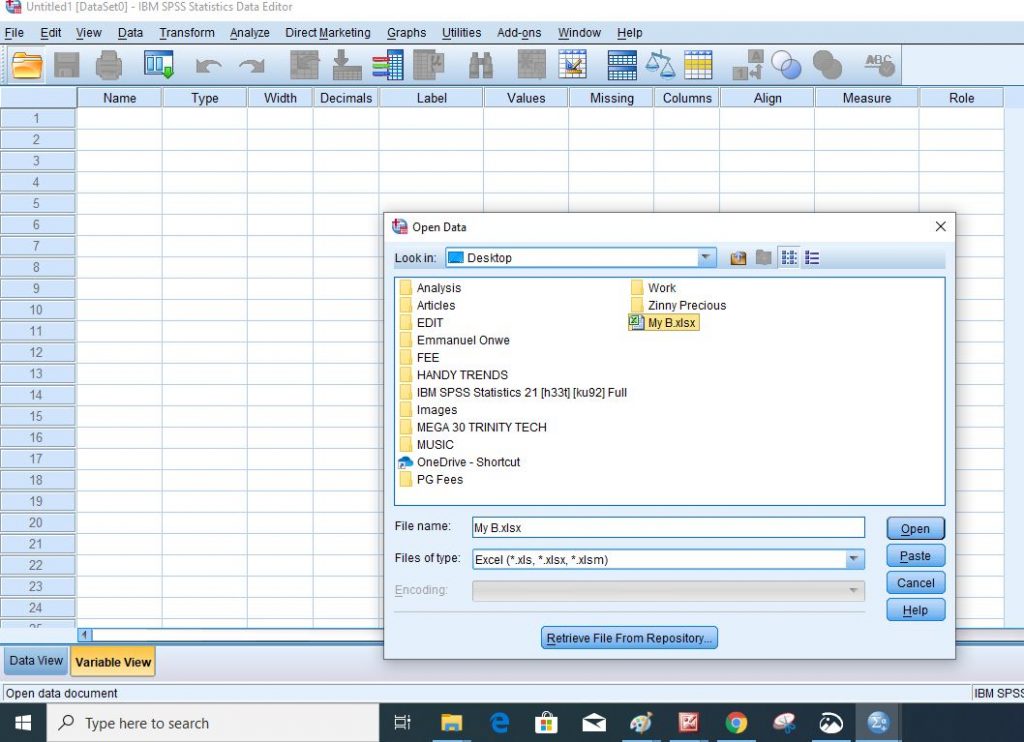
Step 1: Import your excel data codes into SPSS
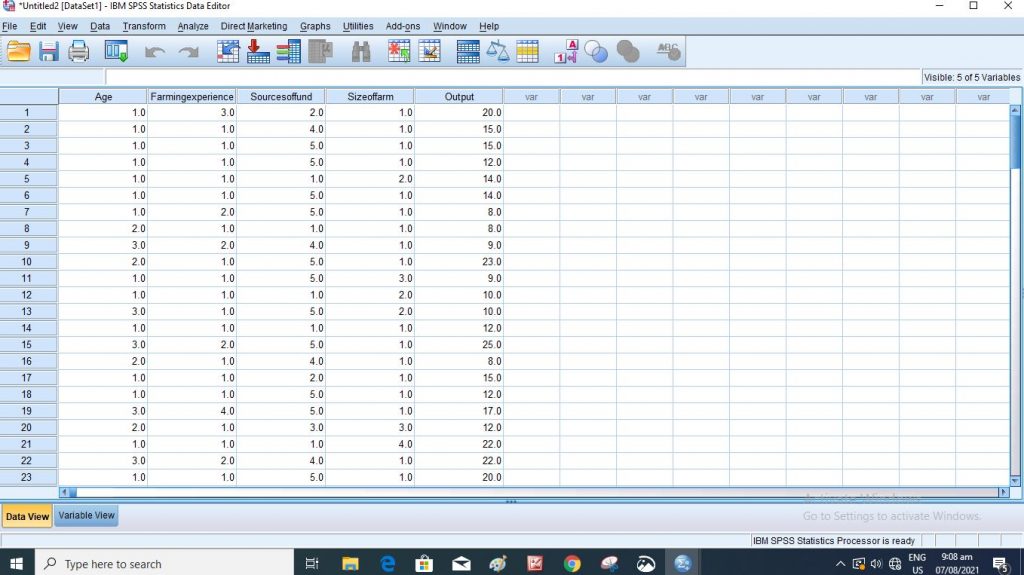
Step 2: This is your dataview in SPSS
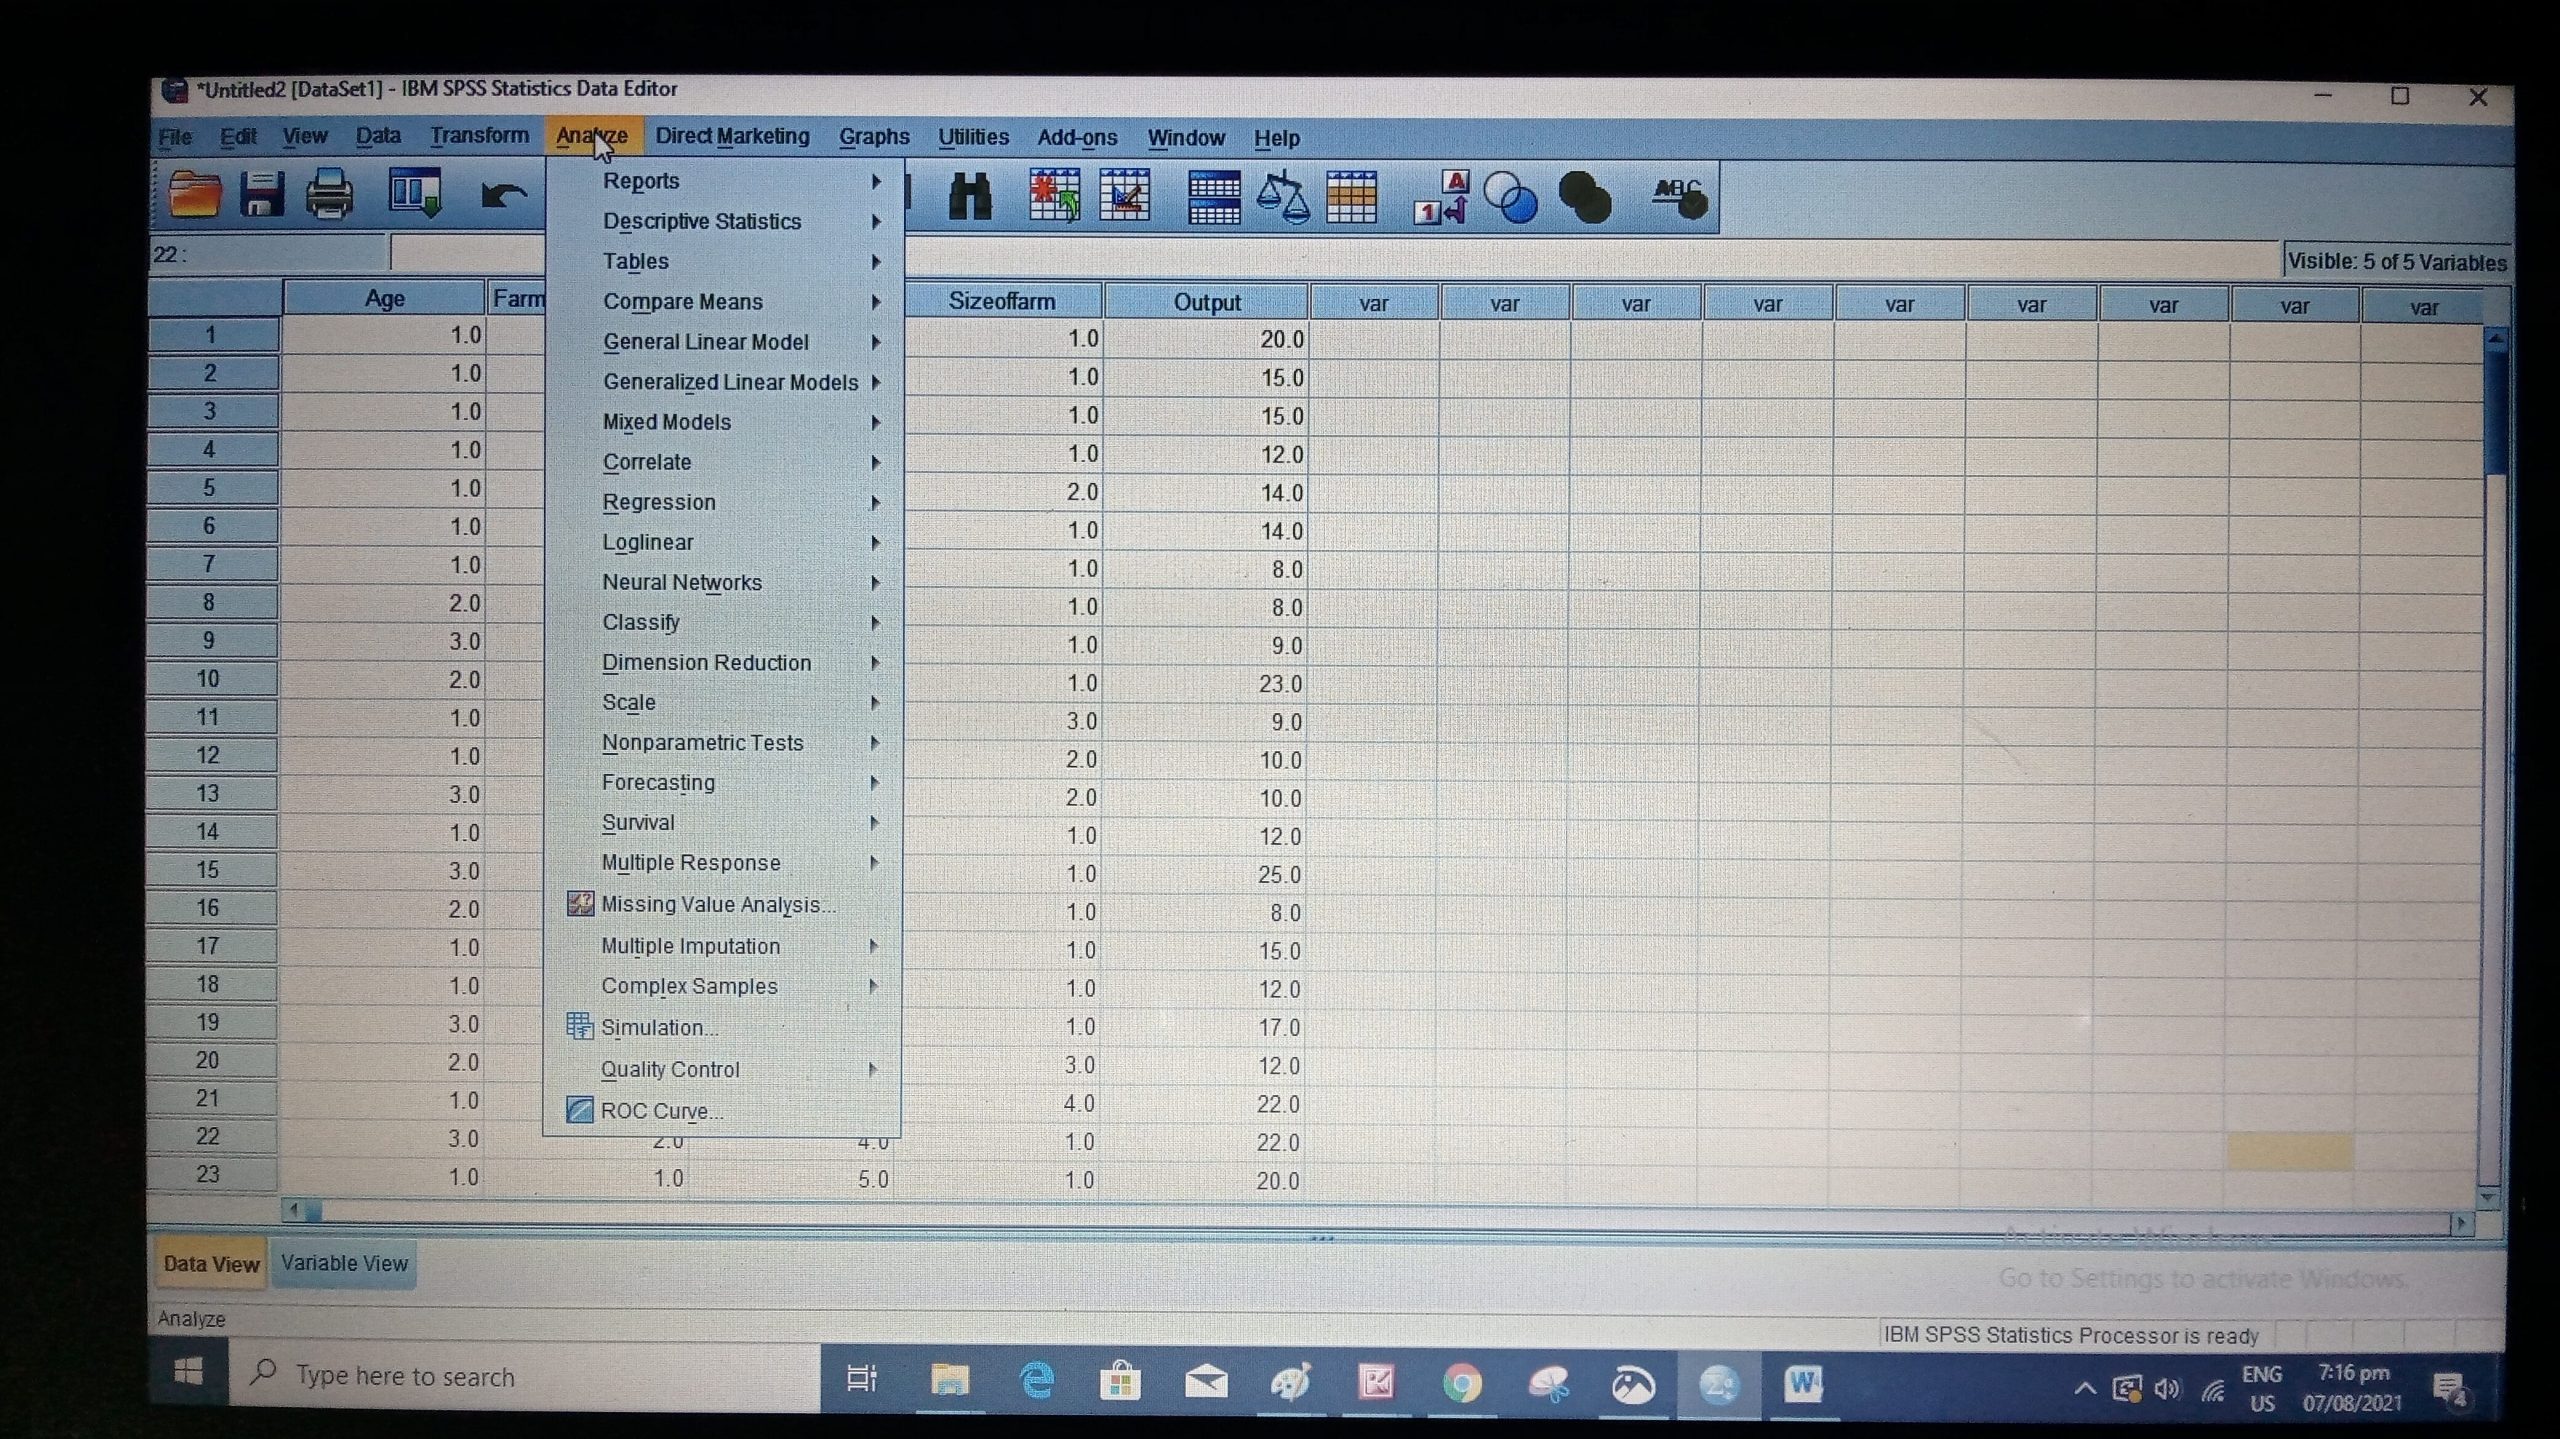
Step 3: Go to analyze at the Top part of your computer in the SPSS dashboard.
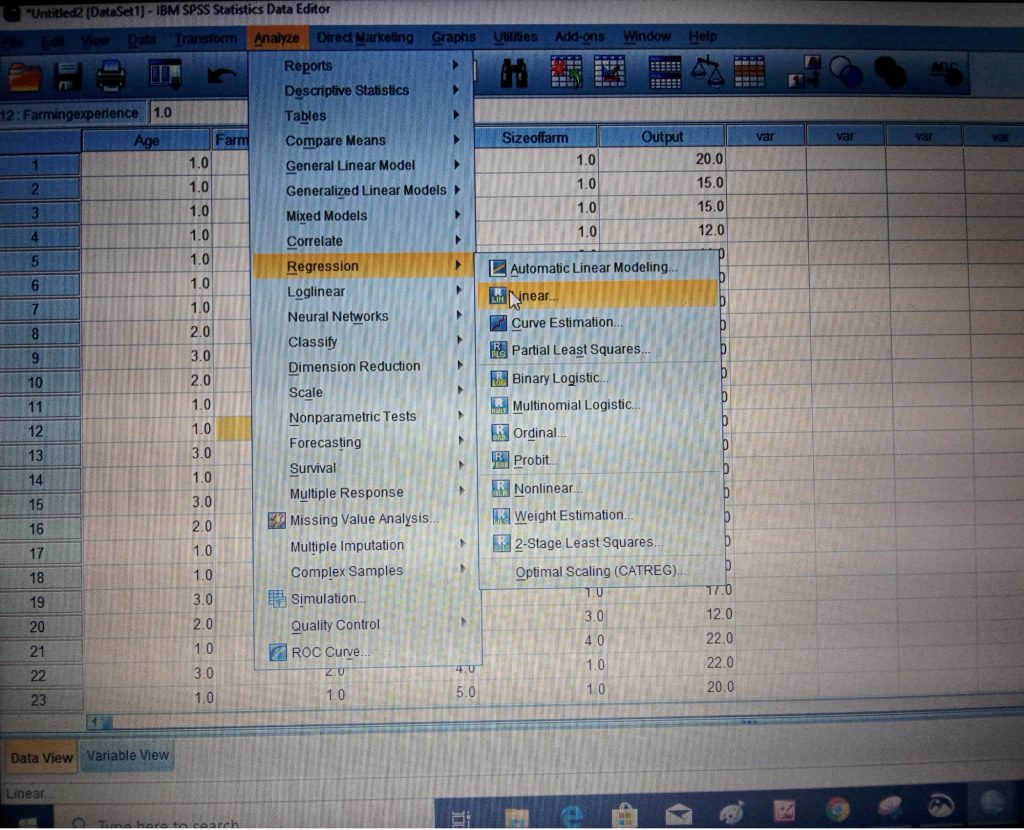
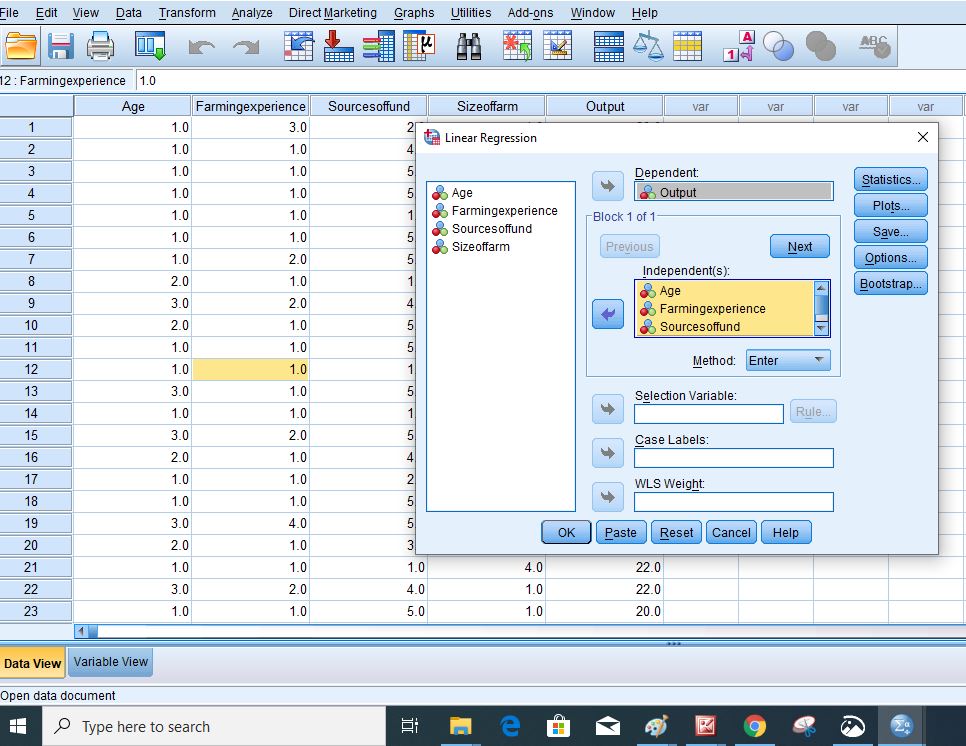
Step 4: Take your cursor to the Regression at the dropdown navigation button for other dropdown navigation menus on Regression and select linear.
Step 5: Move the dependent variable and the independent variables to their respective bars by clicking on them and using the arrows by the sides of the bar to move them.
Step 6: Go to Statistics to select the properties you want to analyze.
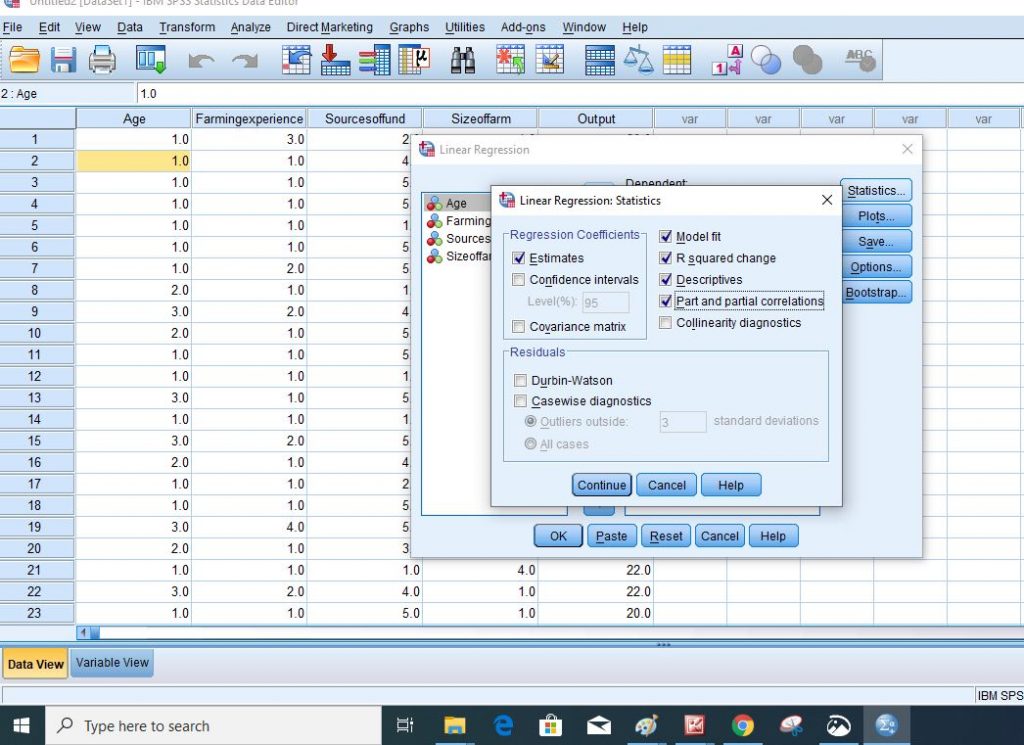
Click “Continue”
Step 7: Got to Plot if you want to get Histogram or Scatter Plots.
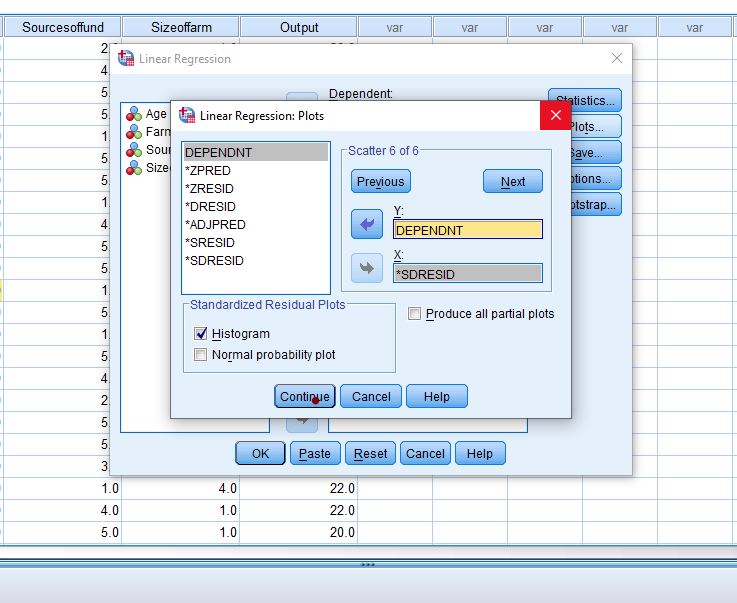
Step 8: Click continue
Step 9: Tap Ok
Step 10: The following are the results that you are going to generate
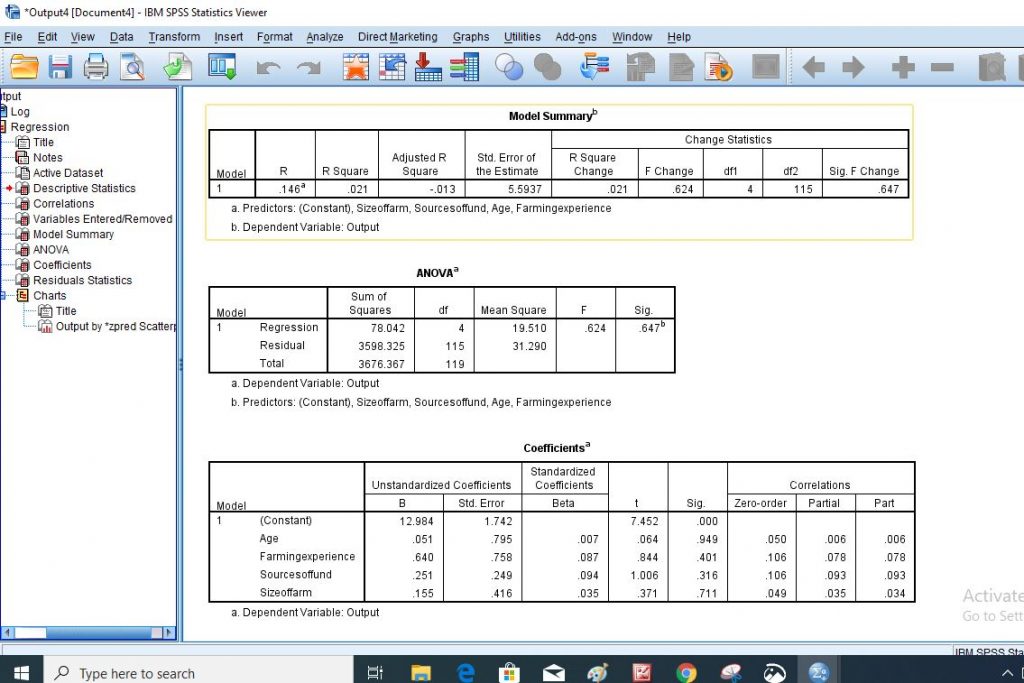
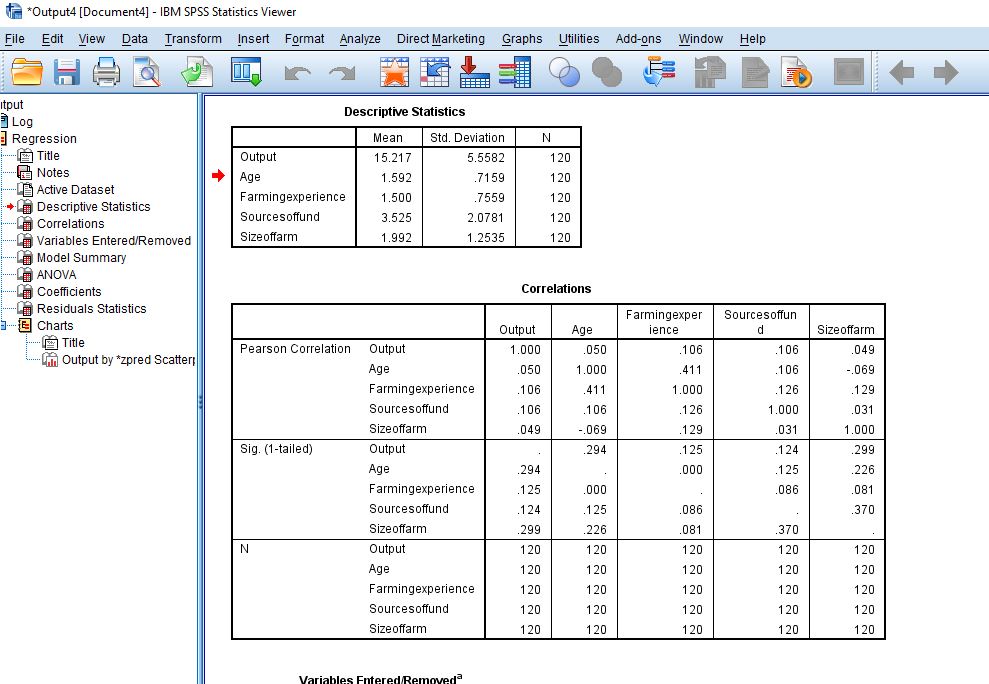
Step 11: Finally, collect the result of the analysis and interpret them carefully based on the information that is required in the work.
I hope you would be able to run a Multiple linear Regression analysis in SPSS with the help of the guidelines provided in this article. Please subscribe to this site by using your email address if you want to be notified any time we publish very educative articles of this kind.
If you have any questions about how to perform Multiple Linear Regression Analysis in SPSS, kindly use the comment section below this article.