
How to Test Hypothesis in Statistics | A – Z Guides Using Practical Examples.
The basis for drawing a good conclusion at the end of any research project is the ability to know How to Test Hypothesis in Statistics.
Are you having any challenge on testing hypothesis at the end of your project work? Do you wish to be thought about the easiest steps on how to draw a perfect conclusion for your research?
I hope somebody would respond positively to the above questions. Right?
All you have to do is to carefully follow this tutorial from the beginning to the end.
What Is Hypothesis In Research?
Hypothesis in a research project can be defined as a recognized verdict about the supposedly outcome of the research work. It can also be described as the conclusion drawn on any case being studied based on the framework of a statistical model that is applied.
Hypothesis is a conjectural statement about the presumed relationship between two or more variables. A hypothesis represents a set of two or more contradictory and often exhaustive possibilities, out of which only one can actually be true.
For instance, at the end your research on the “The Profitability of Yam and Cassava Enterprises in Itu Local Government Area of Akwa Ibom State, Nigeria”, how do you conclude that some selected factors have/have no significant effects on the output within the study area?
Let the selected factors be labour, planting materials, farm size, fertilizer, and capital input
Now, the hypothesis to be studied in this research could be that;
- Factors like labour, planting materials, farm size, fertilizer, capital inputs influencing yam and cassava production have no significant effect on the output of yam/cassava
- Factors like labour, planting materials, farm size, fertilizer, capital input influencing yam and cassava production have significant effect on the output of yam and cassava.
You cannot hold any of the above claims to be true without any proof from the result obtained by applying a statistical model.
Therefore, one can just summarize that hypotheses are what the researcher has kept in view to ascertain their validity based on the outcome of the research work.
Types Of Statistical Hypotheses
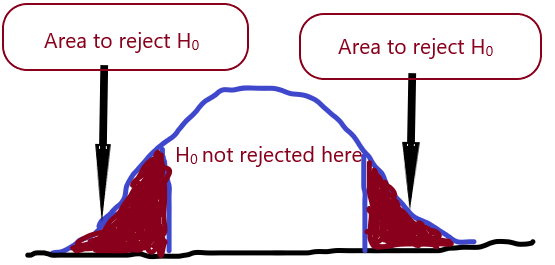
At the end of every research work/project, a hypothesis is meant to be REJECTED or NOT REJECTED, depending on the conclusion that has been drawn. This takes us to the kind/type of hypothesis to be rejected or not rejected.
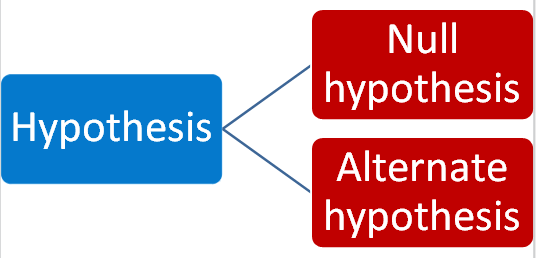
In statistics, there are two major types of hypothesis. These include;
- The Null Hypothesis, and;
- The alternate Hypothesis
The Null Hypothesis
The null hypothesis can be represented by the symbol, H0. It always states the negative side of the difference to be observed in the population. The null hypothesis states that there is no significant change to be found in the population as a result of the tested variables.
The hypothesis that is conditionally held to be true is the Null Hypothesis. In a derivable statistics, it is the null hypothesis that we usually test. This is because it is always easier to disprove the Null hypothesis than to prove the Alternate hypothesis.
The Alternate Hypothesis
The alternate hypothesis can be represented with the symbol, Hi. It states that there is a significant difference to be found in the population under study.
The alternative hypothesis specifies the condition which will stand valid if the null hypothesis does not stand. In statistics, it is the hypothesis that we do not reject if the null hypothesis, H0 is rejected.
Using the previous example that I gave about the Profitability of Yam and Cassava enterprises in Itu Local Government of Akwa Ibom State, Nigeria;
The Null Hypothesis and the Alternate Hypothesis in this research can be defined as follow:
H0 = Factors like labour, planting materials, farm size, fertilizer, capital inputs influencing yam and cassava production have no significant effect on t= he output of yam and cassava.
Mathematically, it can be written as: H0 : µfs = µy
That is, H0 : µfs – µy = 0
Where, µfs = Mean values of the selected factors
µy = Mean values of the outputs of Yam and Cassava
Hi = Factors like labour, planting materials, farm size, fertilizer, capital input influencing yam and cassava production have significant effect on the output of yam and cassava.
Mathematically, it can be written as: Hi : µfs ≠ µy
That is, Hi : µfs – µy ≠ 0
The null hypothesis stated above cannot be ACCEPTED/REJECTED until the output of the statistical analysis of the research has been generated.
Did you understand up to this level? Interesting!
You Can Also Read About: Measures Of Relationship In Statistics | The Tutorial With Practical Examples
Significant Test
The stronghold of researches in many fields of study including Science, Education and Social Sciences is the Null Hypothesis Testing. Testing of the null hypothesis is made possible by the application of some statistical criteria generally recognized as significant tests.
Significant tests are specialized procedures that have been adopted by the researcher to check if there is substantial difference between the sample means which will allow you to rule out sampling error as an explanation for the mean difference.
Test of significance is run at a predetermined probability level for which the null hypothesis is valid, which also allows the researcher to lay a formal claim on the null hypothesis.
A probability level is also referred to as significant level, Alpha (α) level or P-level. It can be described as the significant value that form the benchmark for any judgment that could be placed on the null hypothesis (that is, whether to reject or not reject).
In the statistical analysis of most science and social science discipline, the commonest probability levels that are being employed are the alpha (α) level of 1% or 5%. Any selected Alpha level determines the probability of committing the Type I Error.
Examples of significant tests for parametric statistics are; Analysis of Variance (ANOVA), Analysis of Covariance (ANCOVA), z-test, t-test, test of correlation and so on.
Examples of significant tests for the non-parametric counterparts include; Chi Square, Kruskal – Wallis test, Mann-Whitney U test, Wilcoxon Rank-Sum test Permutation test and so on.
See also:
Making Statistical Decisions
Statistical decision is made by the researcher(s) based on the outcome of the significant testing. The decision is on whether to reject or not reject the null hypothesis.
Whatever decision the researcher is taking, he/she should note that there is no guarantee that such decision is going to be 100% correct. The decision is just based on probability.
There are four possibilities in making statistical decision. These possibilities are:
(i). The null hypothesis holds true. That is, there is no significant difference and the researcher concludes that it is true. ( He/she fails to reject the H0).
(ii). The null hypothesis is false. That is, there is a significant difference and the researcher concludes that it is false. He/she rejects the H0.
(iii). The null hypothesis is actually true and the researcher concludes that is false. He/she rejects the H0.
(iv). The null hypothesis is false and the researcher concludes that it is true. He/she fails to reject the H0.
The first two decisions are the correct decisions to make in statistics while the last two (iii & iv) are incorrect.
Whenever the researcher conclude that the null hypothesis is false when it is obviously true (as in decision iii), he/she commits a Type I Error.
Also, whenever the researcher concludes that the null hypothesis is true when it is actually false (as in decision iv), he/she commits the Type II Error.
Procedures On How To Test For Hypothesis In Research Work
Having followed this tutorial from the beginning to this level, I believe that you will not be confused again as I start to teach you about hypothesis testing in statistics in this section.
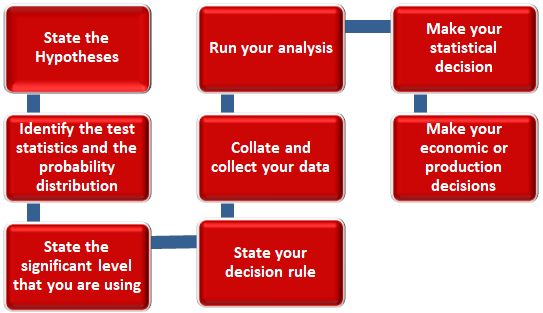
Let me quickly summarize the procedures to follow while trying to test the validity of any statistical hypothesis. The following would guide you very well in testing hypothesis:
Step 1: State the Hypotheses
Step 2: Identify the test statistics and the probability distribution
Step 3: State the significant level that you are using
Step 4: State your decision rule
Step 5: Collate and collect your data
Step 6: Run your analysis
Step 7: Make your statistical decision
Step 8: Finally, Make your economic or production decisions as the case may be.
Kindly follow the above steps sequentially if you want to arrive at the required conclusion in your research projects.
Note: The given procedures are applicable to any kind of research that requires hypotheses testing.
The chart below will help you to understand more about steps in testing hypotheses.
Power of a Statistics Test
The power of a statistics test can be defined as the probability that the test will correctly decide to reject the null hypothesis H0 when the null hypothesis is actually false. It is the basis on which a correct decision is made in statistics.
Power of a statistical test can be determined by
P = 1 – β
Like the significant level, power of a statistics test is set randomly and it should be taken at a high level since the null hypothesis that is false is hoped to be rejected by the researcher and would want to have a high probability by doing so.
Although the power of a statistics test cannot be calculated accurately with 100% precision, there are still a number of ways in which the probability can be increased. They include the following:
- As the alpha level increases. This means that a test performed at 5% alpha level has more power than that which is performed at 1% alpha level. The less stringent the alpha level is, the more likely the null hypothesis will be rejected.
- As the sample size increases. It is more likely to reject the null hypothesis for a sample size 100 than for a sample size of 80. Therefore, the power of a statistics test increases with increase in sample size.
RECOMMENDED POSTS
Duncan’s Multiple Range Test on SPSS
How to Analyze Descriptive Statistics on SPSS
How to Log Transform Data in SPSS
Pearson Correlation Analysis on Excel
Closing Thought
Good hypotheses test is an essential guide for researchers like you in making a perfect decision about any case being studied. It assists the researcher in ensuring good business or production goals as the case may be. The theory tells you what you generally expect from certain line of inquiry.
I hope that you have found the tutorial quite interesting. To share your thoughts about how to test hypothesis in statistics, kindly make use of the comment section below.
PLEASE DO NOT FORGET TO SHARE THIS TUTORIAL TO OTHERS USING THE AVAILABLE SOCIAL MEDIA PLATFORMS.