
This article shows everything that you need to know about the significance of DMRT in statistical analysis and how to use Duncan’s Multiple Range Test in SPSS software.
- What Is Duncan’s Multiple Range Test?
- Needs For Duncan’s Multiple Range Test (DMRT)
- Rules Of Duncan’s Multiple Range Test (DMRT) Model
- Procedure For Duncan’s Multiple Range Test (DMRT)
- Examples Of Duncan’s Multiple Range Test (DMRT) Works
- How To Run Duncan’s Multiple Range Test (DMRT) On SPSS
- How To Know That Each Mean Difference Is Significant
- Abuses Of Duncan’s Multiple Range Test (DMRT)
What Is Duncan’s Multiple Range Test?
Duncan’s Multiple Range Test (DMRT) is one of the multiple comparison procedures that are used in statistical analysis. It is used to compare the means of different kinds of scholarly-based statistics.
Duncan’s Multiple Range Test (DMRT) was invented by a renowned statistician, David B. Duncan in the year, 1955. This invention was a modification of his previously designed Duncan’s Multiple F (DMF) in 1951.
By using the F test, the Duncan’s Multiple F could function in comparison and also in pairwise differences.
Moreover, due to the cumbersomeness of the multiple uses of the F-tests than the range tests as well as the insignificant attention received by the Duncan’s Multiple F (DMF), the Duncan’s Multiple Range Test (DMRT) has to come into play.
With the Duncan’s Multiple Range Test (DMRT), you can cushion the effects of pseudo negative (type two) errors as it contributes to greater risks of ensuring false positive (type one) errors.
The outcome of the Duncan’s Multiple Range Test (DMRT) is usually an inclusive set of means of the analyzed data. For this to be valid, each of the means should not be significantly different from one another.
You can also read about:
Measures Of Relationship In Statistics | The Tutorial With Practical Examples
How To Test Hypothesis In Statistics | A – Z Guides Using Practical Examples
Needs For Duncan’s Multiple Range Test (DMRT)
To check the difference between the means of set of data that is obtained from multiple treatments, the use of Analysis of Variance (ANOVA) procedure is highly recommendable.
However, the Analysis of Variance can only show if the different means actually differ from one another but it will not define exactly how each of the means are different in between themselves, hence the need for the Duncan’s Multiple Range Test (DMRT).
- The Duncan’s Multiple Range Test (DMRT) is one of the Post hoc tests that are used especially for the measurement of the specific differences between pairs of means.
- Also, the Duncan’s Multiple Range Test (DMRT) is more preferable to be used when there is a need to compare large number of pairs of means. This is very useful especially when the different means to be compared are in one table.
Rules Of Duncan’s Multiple Range Test (DMRT) Model
The Duncan’s Multiple Range Test (DMRT) model is run successfully provided that certain assumptions are in place, while keeping other factors constant. These assumptions are the cases in which the model would be valid.
They include the following;
- There are sets of observed means a1, a2, a3,…an. these means are taken independently from the n normally distributed population with actual means, m1, m2, m3,…mn respectively.
- There is a common standard error, e, which is usually unknown. The available estimates, se, are usually independent of the observed means and are taken from a number of degree of freedom, df.
There is an exception to this assumptions; the exception is that the means cannot be said to be statistically significant as long as the means are subsets of the mean which has a non-significant range.
Procedure For Duncan’s Multiple Range Test (DMRT)
Before you start your comparison with the Duncan’s Multiple Range Test (DMRT), it is usually assumed that you have done you Analysis of variance (ANOVA) and that the outcome your analysis has a significant result.
Now, the procedure for using the Duncan’s Multiple Range Test (DMRT) involves the following:
- The difference between the largest mean and the smallest mean.
- The difference between the largest mean and second to the largest mean.
- The difference between the largest mean and the next smallest mean.
The procedure follows in this sequence till you get the difference between the largest mean and second to the largest mean. After which, you take another as follow;
- The difference between the second largest mean and the smallest mean.
- The difference between the second largest mean and the second smallest mean, and so on.
The procedure should be complete once you have gotten to the difference between second to the smallest mean and the smallest mean.
Examples Of Duncan’s Multiple Range Test (DMRT) Works
Duncan’s Multiple Range Test (DMRT) is always used in analyses that involve the comparison of treatments that are factorial in nature or those that correspond to several levels of quantitative or continuous variables.
Some of the works that could be analyzed with the Duncan’s Multiple Range Test (DMRT) model include the following:
- Effect of named treatments on the incidence of post-harvest bacterial soft-rot in tomatoes
- Effects of (honey and garlic) on fingerlings within a specified period of time.
- The effects of 10, 20, 30,…n ppm of certain chemical
- Effects of treatments on a specimens, and so on.
- Agric students’ projects make use of the Duncan’s Multiple Range Test (DMRT) model.
How To Run Duncan’s Multiple Range Test (DMRT) On SPSS
There are great numbers of persons who have been searching for how to run the Duncan’s Multiple Range Test (DMRT) using the SPSS software. That is the reason why this particular section of the tutorial is very crucial.
Running the Duncan’s Multiple Range Test (DMRT) on SPSS is not a very difficult task if you can follow the require procedures as shown in this tutorial.
The correct steps to take while trying to analyze data using the Duncan’s Multiple Range Test (DMRT) model on SPSS are as follow:
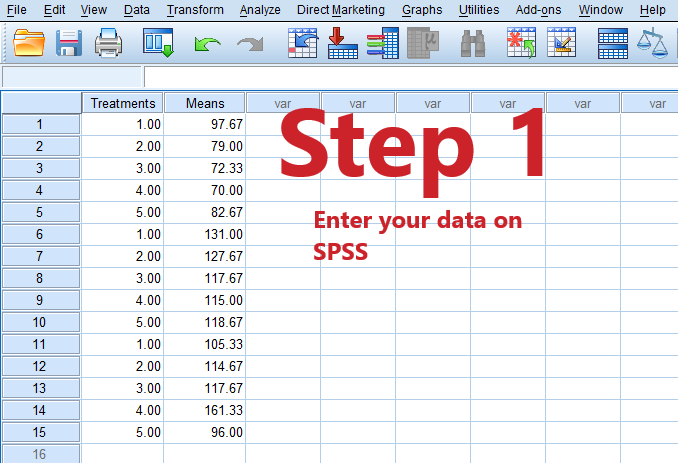
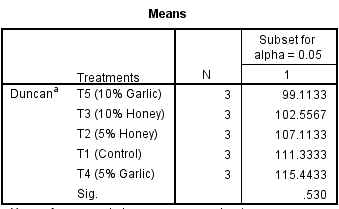
I am going to run an analysis on the “Effects of Honey and Garlic on the Weights of Fingerlings” as an example.
Step 1: Enter your data on SPSS spreadsheet
Step 2: Go to Analyze
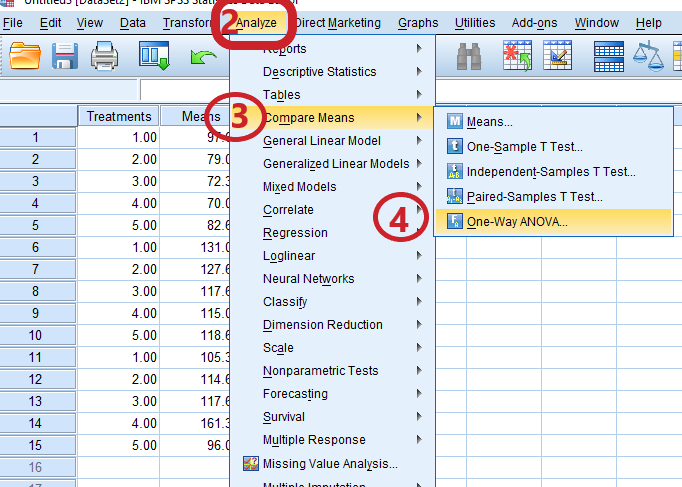
Step 3: Go to Compare Means at the fly out menus
Step 4: Come down to One-Way ANOVA
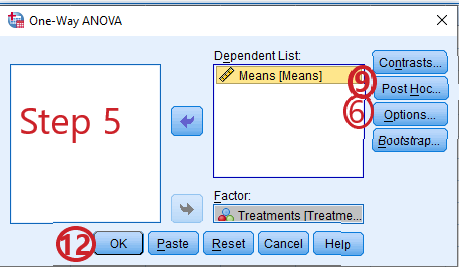
Step 5: Move the dependent and independent variables to the Dependent list and Factor boxes respectively.
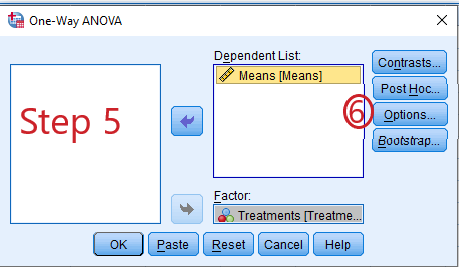
Step 6: Click “Option”
Step 7: Check-In the Descriptive option
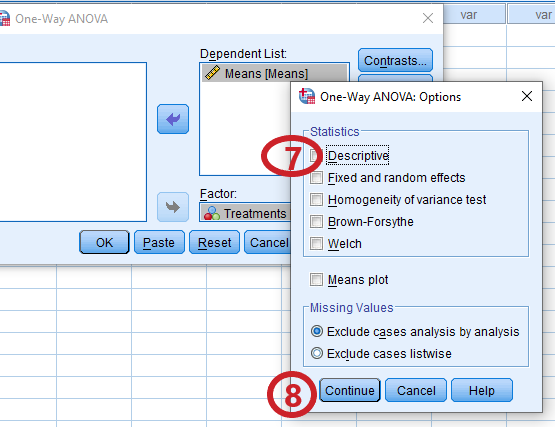
Step 8: Click “Continue”
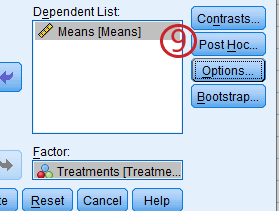
Step 9: Go to “Post Hoc”
Step 10: Check-In the Duncan option
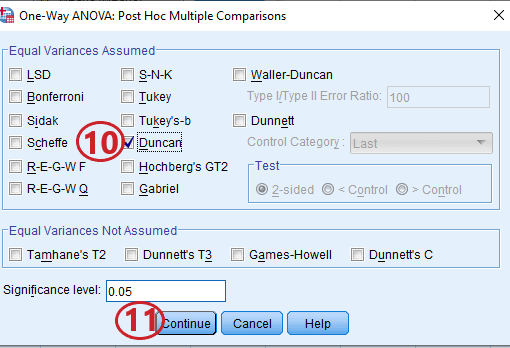
Note: The alpha level of 0.05 has been automatically selected but you can change it to your preferred level.
Step 11: Click “Continue”
Step 12: Finally, click “OK” to generate your output
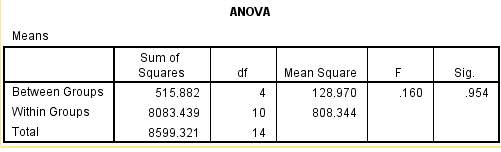
The tables below show the outputs of the Analysis of Variance and the Duncan’s Multiple Range Test (DMRT)
See also: How to Become a Good Data Analyst
How To Know That Each Mean Difference Is Significant
The mean difference can be said to be significant if the value is greater than the corresponding smallest significant range. Otherwise, it is not statistically significant.
See also:
How to Log Transform Data in SPSS
Abuses Of Duncan’s Multiple Range Test (DMRT)
Most times, the Duncan’s Multiple Range Test (DMRT) is inappropriately used in the comparison of factorial treatments and/or treatments that consist of several levels of a quantitative or continuous factor.
To analyze data that involve the treatments which are combinations of the levels of two or more factors, it is not advisable to jump into using the Duncan’s Multiple Range Test (DMRT) model.
First of all, the treatments sum of square should be sectioned into partitions that are corresponding to the main effects and their interactions.
The sum of squares of for main effects and interactions should be sectioned further into single degree of freedom orthogonal contrasts using the linear combinations of the treatment means.
It is only when this partitioning of the sum of squares are no more possible that the use of the Duncan’s Multiple Range Test (DMRT) to compare the means would be considered.
Moreover, when treatments correspond to levels of quantitative variable, using the Duncan’s Multiple Range Test (DMRT) is not the best for such analyses.
In that case, it is perfect to consider Curve-fitting or Regression Analysis as the suitable technique for the Analysis.
Recommended Posts
How to Run Pearson Correlation Analysis in Excel
How to Analyze Descriptive Statistics on SPSS
I hope you have followed this tutorial from the beginning to the end and you have found it helpful. For any thought or comments about the Duncan’s Multiple Range Test (DMRT) on SPSS, kindly make use of the comment section below.
Do well by sharing this educative tutorial with others using any of the social media platforms given below.