
Descriptive statistics is the analytical presentation of characteristics of statistical variables. Descriptive statistics show the environmental features of variables based on the area where samples are collected for such variables.
In descriptive statistics, the summary of samples in a population is given.
Descriptive statistics are statistics that describe a variable’s central tendency (the ‘middle’ or expected value) and dispersion (the distribution of the variable’s responses).
You should note that SPSS will calculate statistics even if the measure of central tendency and dispersion are not relevant.
What do I mean by inappropriate descriptive statistics?
The General Social Survey includes two attributes for the variable SEX: male or female. (Whether or not this is exhaustive is another discussion).
Assume you have 35 people in your dataset: 20 have identified as male and 15 people have identified as female. Although you could add up all of the 1s (males) and 2s (females) and then divide by 35, the average, 1.4, makes no sense.
Central Tendency
The mean is a statistical average. It is the ratio of sum of all the data values to the number of data. The median is the datum that is in the middle of the data when it is rank-ordered (from lowest to highest).
The mode is the value that has the most occurrence frequency. Different levels of measurement can be measured using the central tendencies as grouped below:
Nominal: Mode
Ordinal: Median, Mode
Scale: Mean, Median, Mode
SPSS uses the term “Scale” for Interval and Ratio levels of measurement.
Dispersion
It is also necessary that I show you dispersion is all about. It is how far your data spread out around the “central tendencies”. You can analyze dispersion by using the following:
Nominal: None
Ordinal: Range, Interquartile Range
Scale: Range, Interquartile Range, Variance, Standard Deviation
Descriptive statistics, just like any other statistical analysis, can also be analyzed using SPSS Statistical tool. The purpose of this article is to teach you how to Analyze Descriptive Statistics with the help of SPSS.
If you have been wishing to be running your analysis, especially descriptive statistics by yourself, I would advise you to endeavour to read this educative article.
Unfortunately, most people cannot still run one of the commonest Statistical Analyses, which is descriptive statistics on SPSS. In this article, I have taken time to break down every step by step guide required to get descriptive statistics done in the SPSS tool.
Related Posts:
How To Test Hypothesis In Statistics | A – Z Guides Using Practical Examples
How To Test Hypothesis In Statistics | A – Z Guides Using Practical Examples
Measures Of Relationship In Statistics | The Tutorial With Practical Examples
Examples of Works that can be Analyzed with Descriptive Statistics:
Socioeconomic Characteristics: Such as; age, occupation, location, income, e.tc
Constraint Factors: Such as finance, time, health, status, e.t.c
Step by Step Guide on How to Analyze Descriptive Statistics in SPSS
In this section of the article, I will be presenting to you steps in which you can follow if you want to be analyzing descriptive statistics by yourself in SPSS. Follow these simple guidelines to ensure error-free work on descriptive statistics analysis.
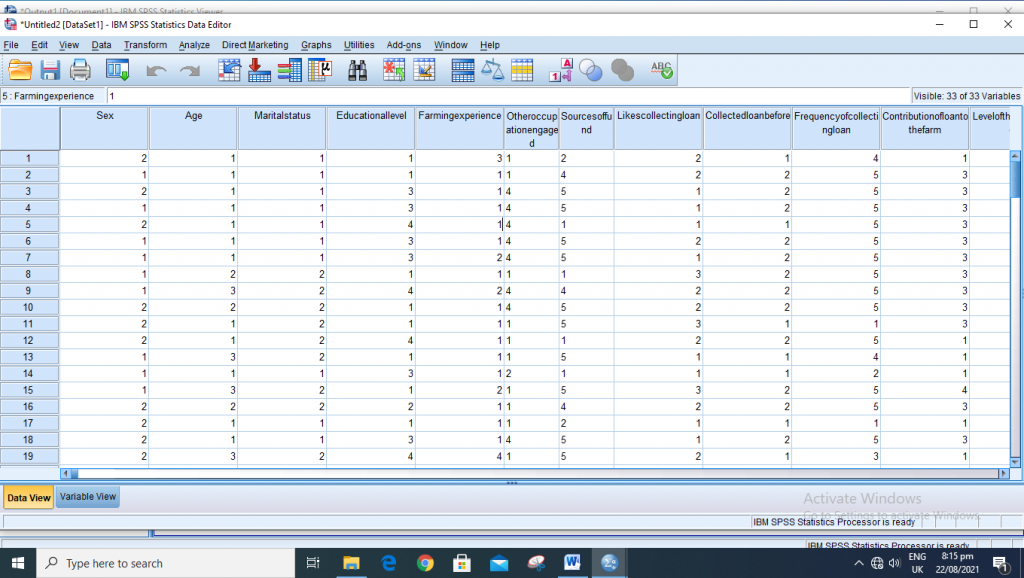
Step 1: Open your data in SPSS.
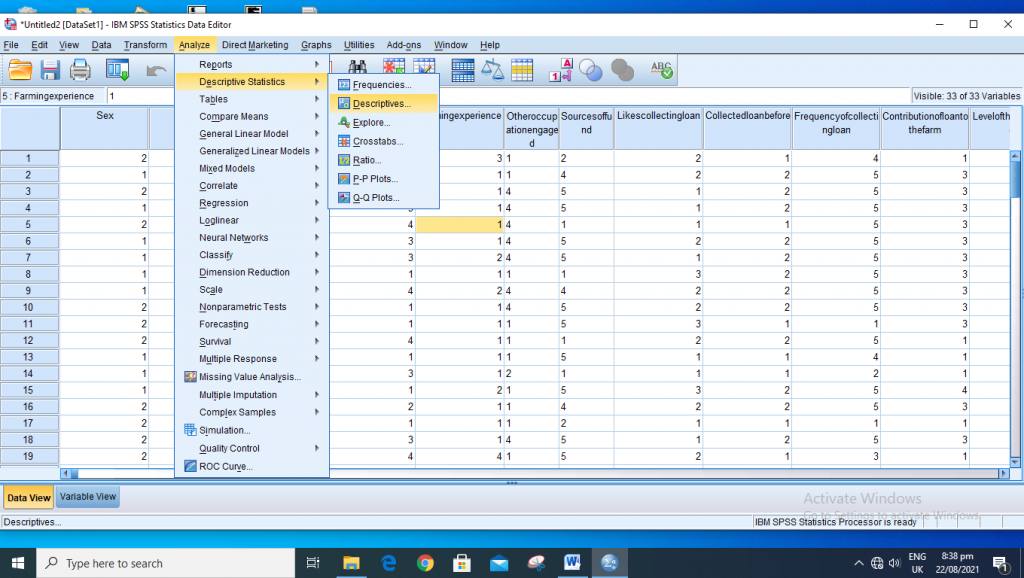
Step 2: Go to “Analyze” on the upper part of your SPSS platform
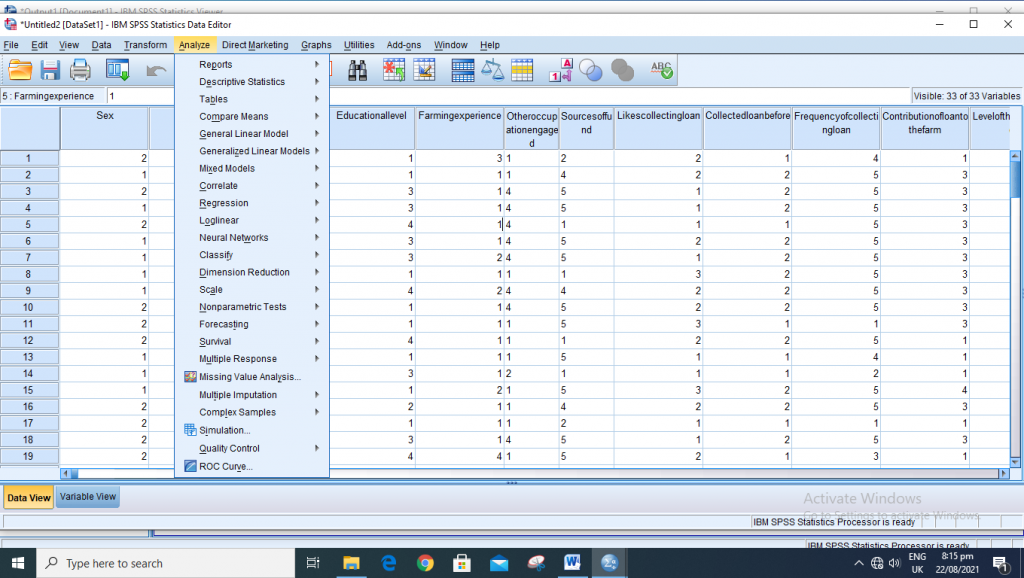
Step 3: Come down to “Descriptive statistics” to bring out the fly out menu

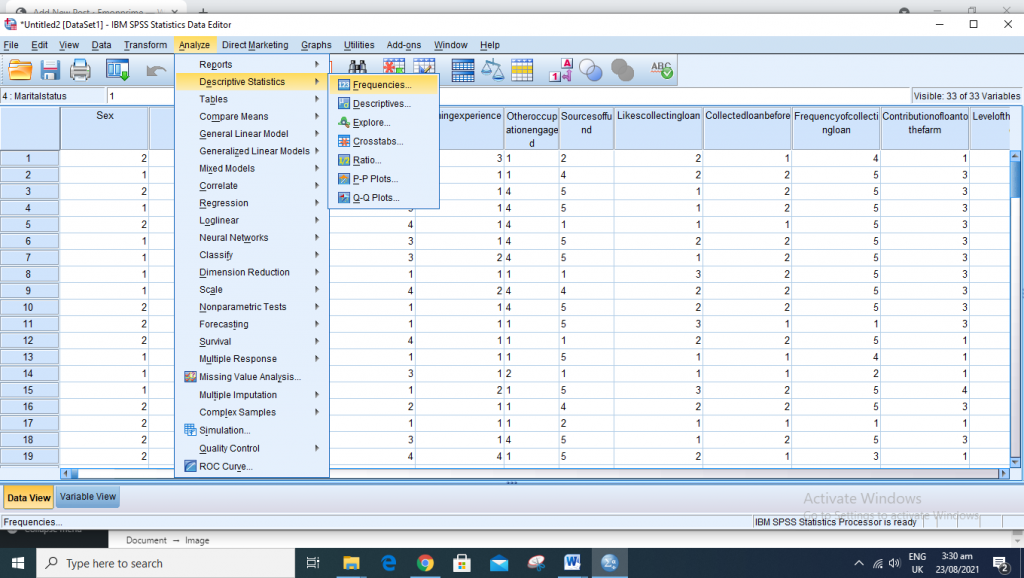
Step 4: From methods that are available, select whichever one you want to make use of.
For Frequency Method: Click on Frequencies
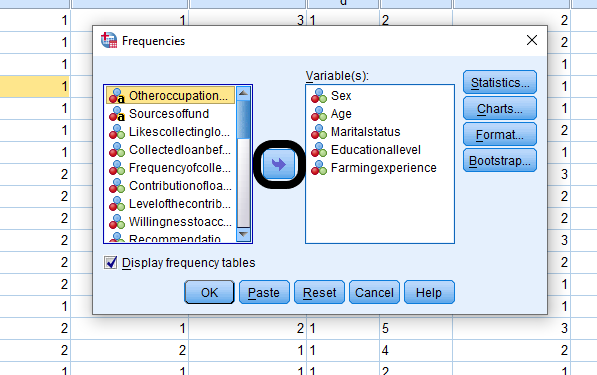
Step 5: Select your variable(s) and move them to the variable (s) dialogue box using the blue arrow
Step 6: Go to “Statistics” and select all the Descriptive statistics that you want to generate in your outputs. After which, click “Continue“
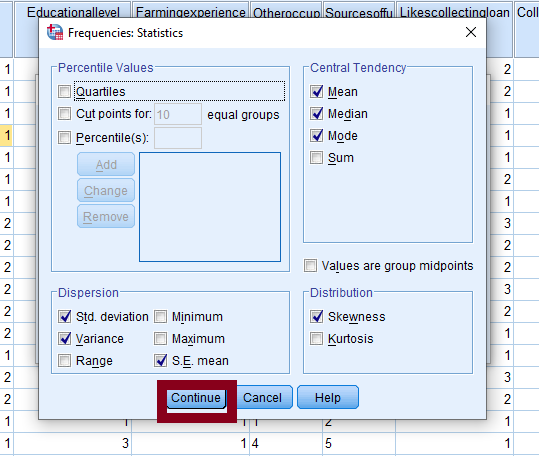
You can also choose to plot histogram with your data.
Step 7: Click Ok to generate your results
For Descriptive Method:
Step 1: Open your data in SPSS.
Step 2: Go to “Analyze” on the upper part of your SPSS platform
Step 3: Come down to “Descriptive statistics” to bring out the fly out menu
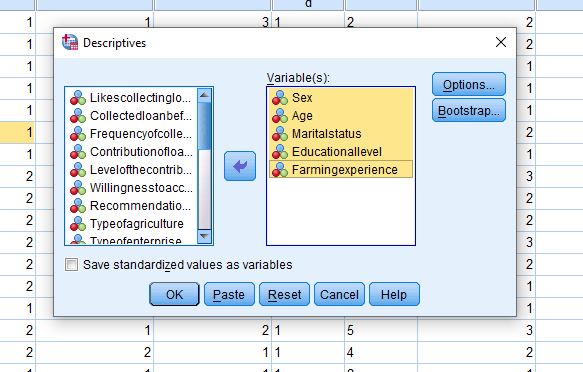
Step 4: Select “Descriptives”
Step 5: Select your variables and move them to the variable (s) box
Step 6: Go to “Options…” >>
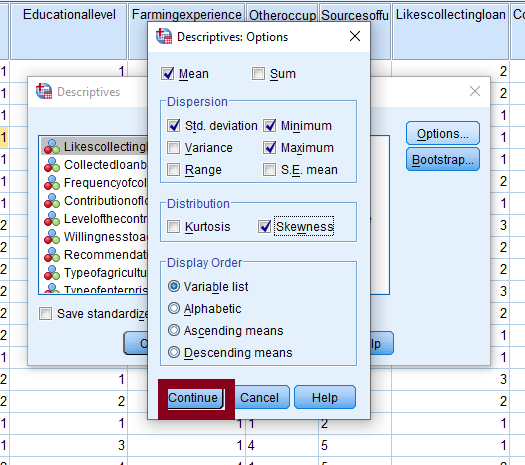
Step 7: Set your Descriptive Options>> click on Continue
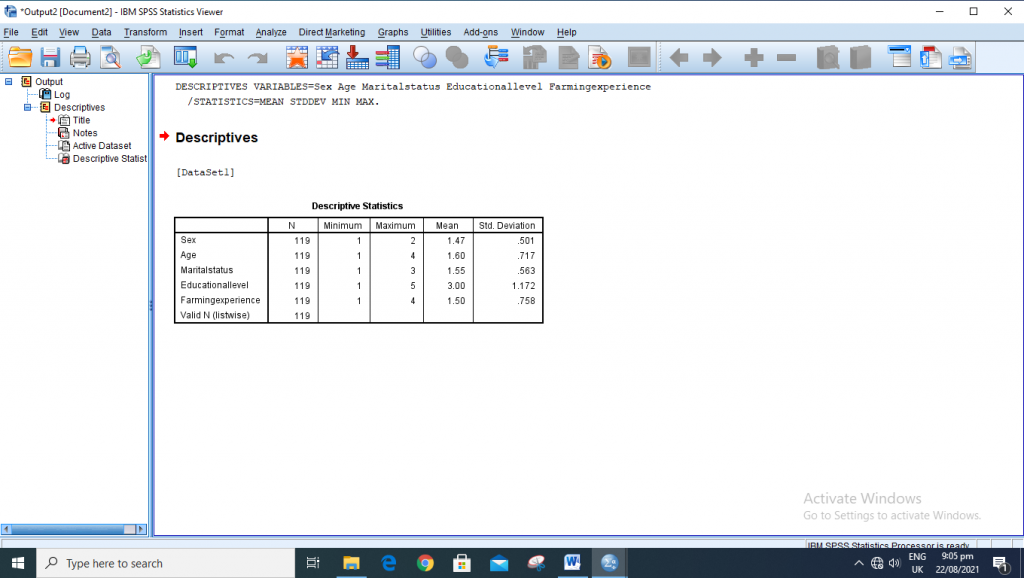
Step 8: Click Ok to generate your results
For Explore Method
Explore method of descriptive statistical analysis is used for the analysis of data that are normally distributed.
Step 1: Open your data in SPSS.
Step 2: Go to “Analyze” on the upper part of your SPSS platform
Step 3: Come down to “Descriptive statistics” to bring out the flyout menu
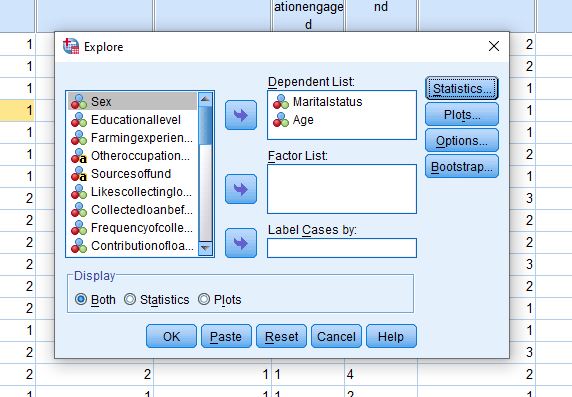
Step 4: Click on “Explore“

Step 5: Select your Dependent List (the variable(s) to be analyzed)
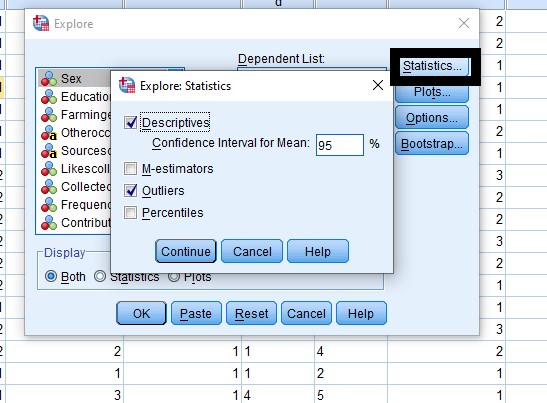
Step 6: Open statistics and select the one you want to use and click on Continue
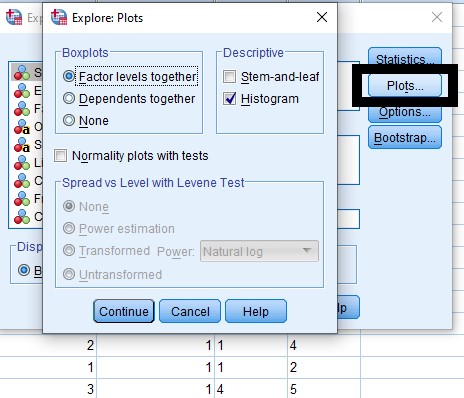
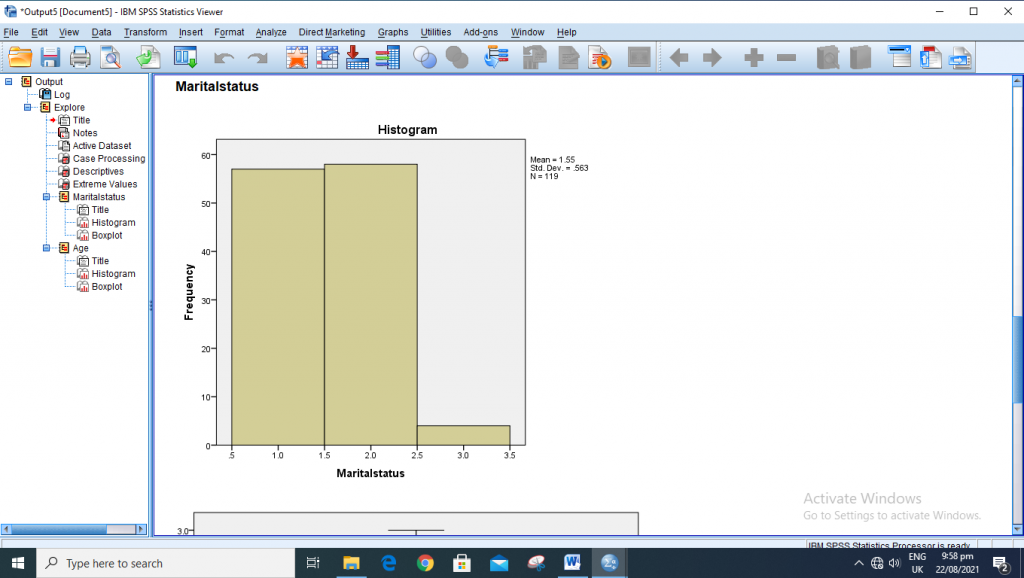
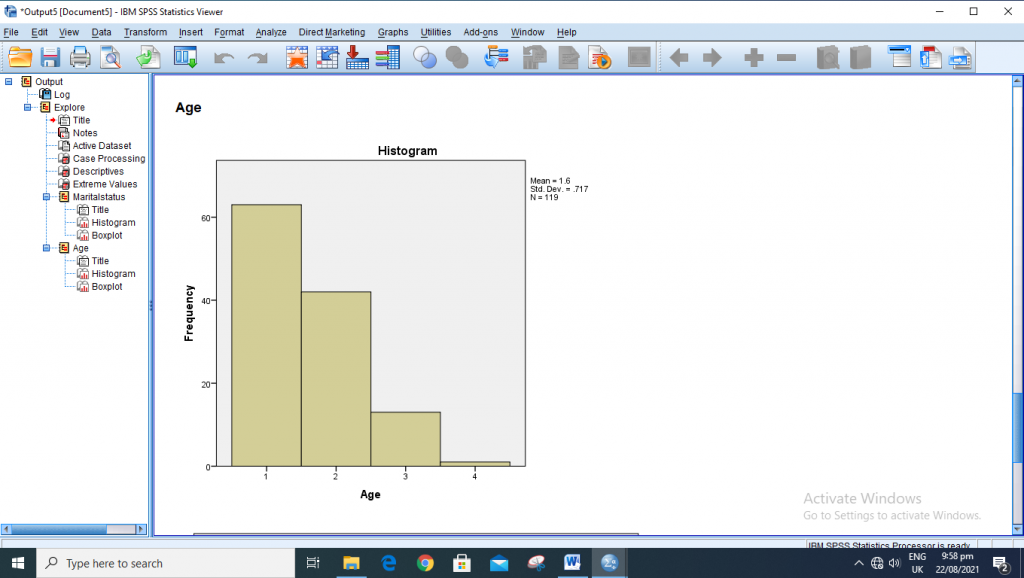
Step 7: Open “plots”, select Histogram and click on Continue
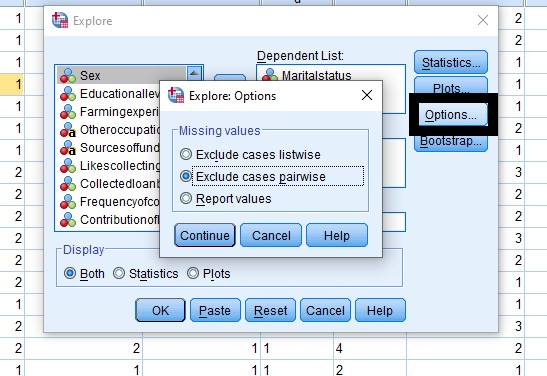
Step 8: Open “Options…” and select from either Exclude cases listwise, Exclude cases pairwise or Report values and click on Continue
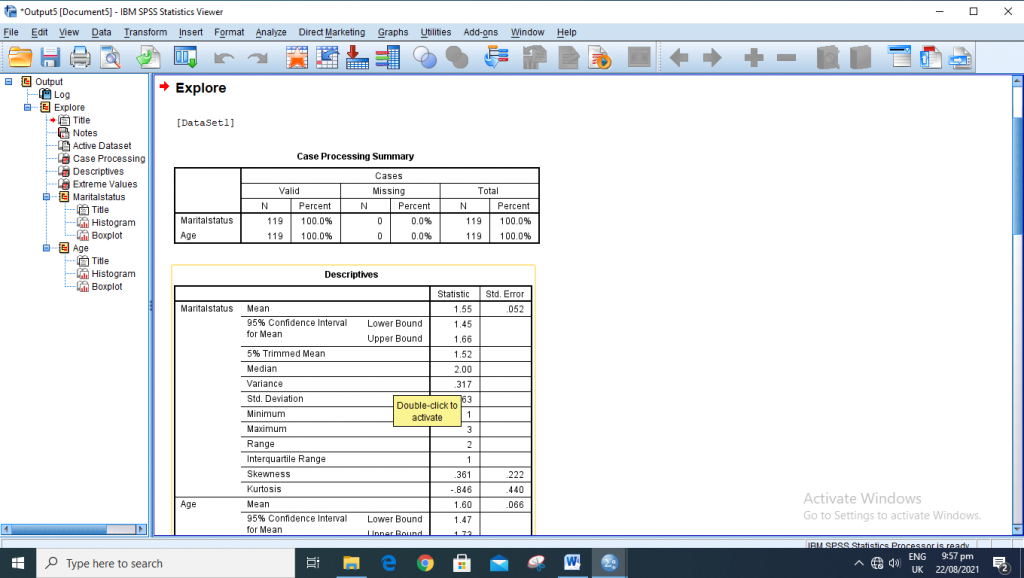
Step 9: Click on Ok to generate your results.
See also: How to Analyze Multiple Regression in SPSS.
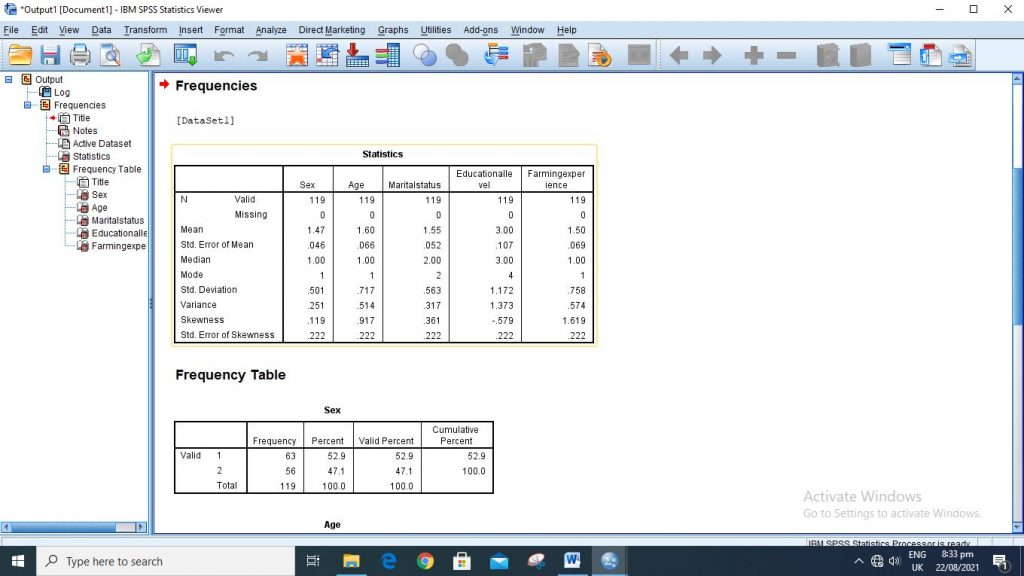
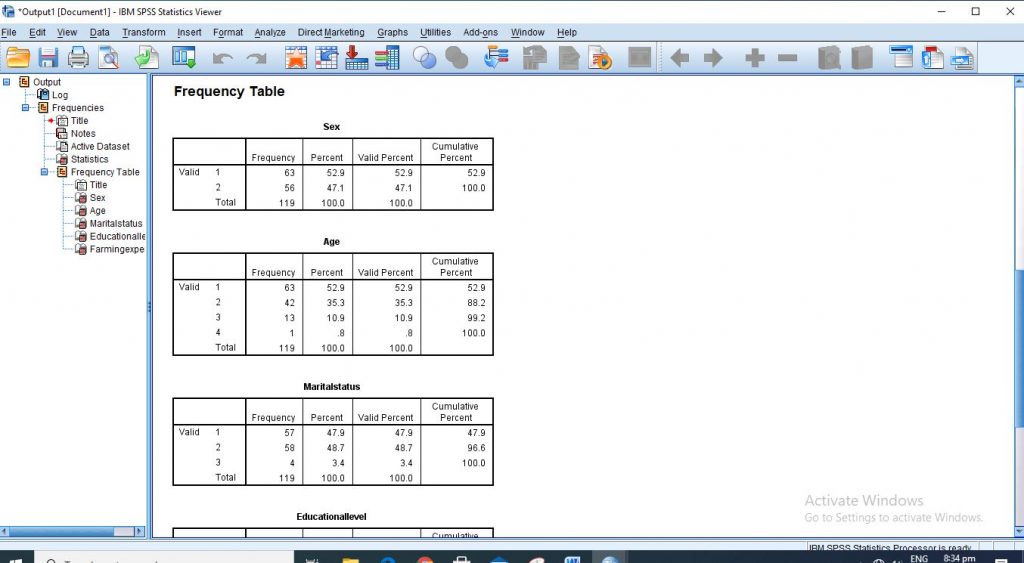
Running of Descriptive Statistics in SPSS is quite easy if you can follow the above-stated guidelines. Once you are done with the analysis, the next things to do are to extract your values from your output and start your interpretation gradually.
Recommended Posts
Duncan’s Multiple Range Test in SPPS | A – Z Guides on the Analyses
Pearson Correlation Analysis in Excel
How to Become A Data Analyst Without | No Is Certificate Needed
I hope this article has helped you. If you would like to always be notified about any other educative articles of this kind, make sure that you subscribe with your email address on this website.
If you have any other questions on How to Analyze Descriptive Statistics in SPSS, kindly use the comment section below this article.
You are free to share this article with your friends via any platform.

Best explanation. Can you add interpretation as well? I mean how to interpret results accordingly to APA
Read about How to Test Hypothesis in statistics | A – Z guides using the link: https://emonprime.com/how-to-test-hypothesis-in-statistics/
to understand how to interpret your results.